ElasticSearch安装及实践

elasticsearch kibana logstash ELK 最终选用低版本运行

1. linux的docker中安装

1.1. 手动安装

https://www.elastic.co/cn/downloads/past-releases/elasticsearch-5-6-11

下载 tar.gz文件,解压

1
2
3
4
5
6
7
8
9
10
# 解压
tar -zxvf elasticsearch-5.6.11.tar.gz

# 重命名
mv elasticsearch-5.6.11 es5

cd es5/bin

# 运行
./elasticsearch

Native memory allocation (mmap) failed to map 1973026816 bytes for committing reserved memory.

修改elasticsearch初始内存和最大内存

1
2
3
4
vi /app/es/es5/config/jvm.options

-Xms256m
-Xmx256m

再次运行

can not run elasticsearch as root

es因为安全问题拒绝使用root用户启动;

创建用户

1
2
3
4
5
6
7
cd /app/es
useradd es
echo '123456'|passwd --stdin es
chown -R es:es ./
su es
cd /app/es/es5/bin
./elasticsearch -d

max virtual memory areas vm.max_map_count [65530] is too low, increase to at least [262144]

从报错信息看出需要修vm.max_map_count的内存大小,切换到root账户,命令 su root,修改sysctl.conf文件 命令:vi /etc/sysctl.conf,最后添加:

1
vm.max_map_count=655360

输入命令:sysctl -p

再次切换到es用户 su es,运行elasticsearch

ip:9200无法访问

修改config中的elasticsearch.yml

1
2
3
4
5
6
7
# Set the bind address to a specific IP (IPv4 or IPv6):
#
network.host: 0.0.0.0
#
# Set a custom port for HTTP:
#
http.port: 9200

1.2. docker中安装

安装镜像 docker pull elasticsearch:5.6.11

创建本地文件

mkdir -p /mydata/elasticsearch/config

mkdir -p /mydata/elasticsearch/data

echo “http.host: 0.0.0.0” >> /mydata/elasticsearch/config/elasticsearch.yml

创建容器

1
2
3
4
5
6
7
8
9
10
11
12
13
14
15
16
17
docker run 
--name elasticsearch #容器名
#端口映射 9200暴露外部端口 9300 内部集群交互
# 主机部分:容器部分
-p 9200:9200 -p 9300:9300
-e "discovery.type=single-node"
#elasticsearch初始内存和最大内存
-e ES_JAVA_OPTS="-Xms128m -Xmx128m"
# 内部配置文件挂载到本地
-v /mydata/elasticsearch/config/elasticsearch.yml:/usr/share/elasticsearch/config/elasticsearch.yml
#数据存储到本地
-v /mydata/elasticsearch/data:/usr/share/elasticsearch/data
# 插件目录
-v /mydata/elasticsearch/plugins:/usr/share/elasticsearch/plugins
# 后台启动elasticsearch
-d
elasticsearch:5.6.11

命令

1
2
3
4
5
6
7
8
9
10
11
[root@192 /]# docker pull elasticsearch:5.6.11
[root@192 /]#
[root@192 /]# mkdir -p /mydata/elasticsearch/config
[root@192 /]# mkdir -p /mydata/elasticsearch/data
[root@192 /]# chmod 777 /mydata/elasticsearch/data
[root@192 /]# mkdir -p /mydata/elasticsearch/plugins
[root@192 /]# echo "http.host: 0.0.0.0" >> /mydata/elasticsearch/config/elasticsearch.yml
[root@192 /]#
[root@192 /]# docker run --name elasticsearch -p 9200:9200 -p 9300:9300 -e "discovery.type=single-node" -e ES_JAVA_OPTS="-Xms256m -Xmx256m" -v /mydata/elasticsearch/config/elasticsearch.yml:/usr/share/elasticsearch/config/elasticsearch.yml -v /mydata/elasticsearch/data:/usr/share/elasticsearch/data -v /mydata/elasticsearch/plugins:/usr/share/elasticsearch/plugins -d elasticsearch:5.6.11
760ba5e8259c75eb577e493537b632ba4750cfae8f8e14ad361762d2e6a21d2d
[root@192 /]#

main ERROR No Log4j 2 configuration file found.

1
2
3
4
5
6
7
8
9
10
11
12
13
14
15
16
17
18
19
20
21
docker container ls -a

# 进入容器内部
docker exec -it elasticsearch /bin/bash
# 得到 elasticsearch 的安装目录
pwd
/usr/share/elasticsearch/plugins
# 查看目录结构
ls
NOTICE.txt README.textile bin config data lib logs modules plugins

# 拷出配置文件
docker cp elasticsearch:/usr/share/elasticsearch/config /app/es/docker-es5/config

# 停止
docker container stop elasticsearch
# 删除
docker container rm elasticsearch

# 重新创建
docker run --name elasticsearch -v /mydata/elasticsearch/config/elasticsearch.yml:/usr/share/elastcisearch/config/elasticsearch.yml -v /mydata/elasticsearch/data:/usr/share/elasticsearch/data -v /mydata/elasticsearch/plugins:/usr/share/elasticsearch/plugins -p 9200:9200 -p 9300:9300 -e "discovery.type=single-node" -e ES_JAVA_OPTS="-Xms256m -Xmx256m" -d elasticsearch:5.6.11

再次运行

WARNING: IPv4 forwarding is disabled. Networking will not work.docker镜像没有网络

1
2
3
4
5
6
7
8
9
10
su root
vi /etc/sysctl.conf

# 配置转发
net.ipv4.ip_forward = 1

sysctl -p

# 是否生效
sysctl net.ipv4.ip_forward

查看运行情况

1
2
3
4
5
[root@192 /]# docker ps
CONTAINER ID IMAGE COMMAND CREATED STATUS PORTS NAMES
760ba5e8259c elasticsearch:5.6.11 "/docker-entrypoint.…" 17 seconds ago Up 14 seconds 0.0.0.0:9200->9200/tcp, 0.0.0.0:9300->9300/tcp elasticsearch
[root@192 /]# systemctl stop firewalld
[root@192 /]#

远程访问 http://192.168.0.101:9200/

1
2
3
4
5
6
7
8
9
10
11
12
13
14
15
16
// 20200331013255
// http://192.168.0.101:9200/

{
"name": "efBli3S",
"cluster_name": "elasticsearch",
"cluster_uuid": "RmnRPDI-T4G8hOH92bX5wQ",
"version": {
"number": "5.6.11",
"build_hash": "bc3eef4",
"build_date": "2018-08-16T15:25:17.293Z",
"build_snapshot": false,
"lucene_version": "6.6.1"
},
"tagline": "You Know, for Search"
}

at least one of [discovery.seed_hosts, discovery.seed_providers, cluster.initial_master_nodes] must be configured

1.2.1. es集群

1.2.1.1. es1

/mydata/elasticsearch/config/elasticsearch.yml

1
2
3
4
5
6
7
8
9
10
11
12
13
14
15
16
17
18
19
20
21
22
23
24
25
26
27
28
29
30
31
32
33
34
35
36
37
#开启跨域
http.cors.enabled: true
http.cors.allow-origin: "*"

# 集群名
cluster.name: elasticsearch

# 节点名
node.name: 101-es1

# 指定该节点是否有资格被选举成为master节点,默认是true,es是默认集群中的第一台机器为master,如果这台机挂了就会重新选举master
node.master: true

# 允许该节点存储数据(默认开启)
node.data: true

#最大集群节点数
node.max_local_storage_nodes: 3

# 允许任何ip访问
network.host: 0.0.0.0

#发布地址,一个单一地址,用于通知集群中的其他节点,以便其他的节点能够和它通信 (设置为此集群宿主机的ip地址)
network.publish_host: 192.168.0.101

#es对外通信端口
http.port: 9200

#es对内通信端口
transport.tcp.port: 9300

# 通过这个ip列表进行节点发现
discovery.zen.ping.unicast.hosts: ["192.168.0.101:9300", "192.168.0.101:9301","192.168.0.101:9302"]

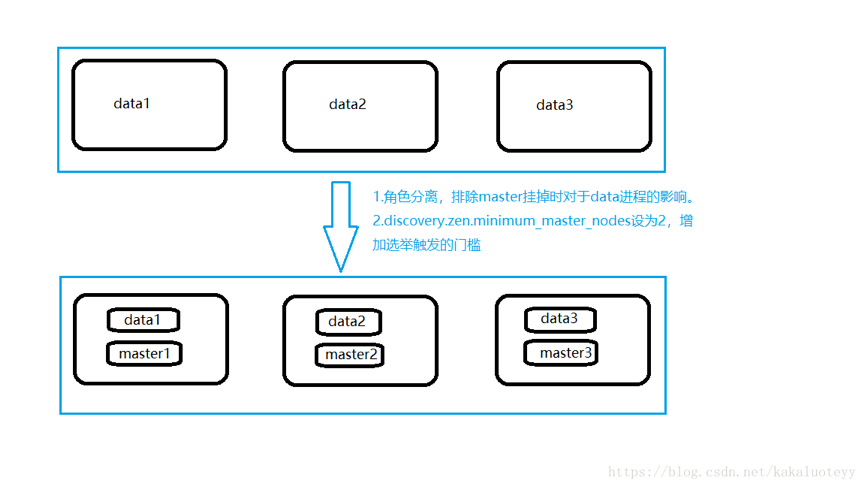
# Prevent the "split brain" by configuring the majority of nodes (total number of master-eligible nodes / 2 + 1):
# 如果没有这种设置,遭受网络故障的集群就有可能将集群分成两个独立的集群 – 导致脑裂 - 这将导致数据丢失
discovery.zen.minimum_master_nodes: 2

修改文件名

1
[linux@localhost mydata]$ mv elasticsearch elasticsearch1

创建容器

1
2
3
4
5
6
7
8
9
[linux@localhost /]$ docker run --name es1 -p 9200:9200 -p 9300:9300 -e ES_JAVA_OPTS="-Xms128m -Xmx128m" -v /mydata/elasticsearch1/config/elasticsearch.yml:/usr/share/elasticsearch/config/elasticsearch.yml -v /mydata/elasticsearch1/data:/usr/share/elasticsearch/data -v /mydata/elasticsearch1/plugins:/usr/share/elasticsearch/plugins -d elasticsearch:5.6.11
f3f915ff2443bc850b80831829983e7090c8988d420588266001c82898d216b7
[linux@localhost /]$
[linux@localhost /]$ docker ps
CONTAINER ID IMAGE COMMAND CREATED STATUS PORTS NAMES
f3f915ff2443 elasticsearch:5.6.11 "/docker-entrypoint.…" 39 seconds ago Up 33 seconds 0.0.0.0:9200->9200/tcp, 0.0.0.0:9300->9300/tcp es1
[linux@localhost /]$ docker logs f3f915ff2443
ERROR: [1] bootstrap checks failed
[1]: max virtual memory areas vm.max_map_count [65530] is too low, increase to at least [262144]

修改linux进程数限制

1
2
3
4
5
6
[linux@localhost /]$ su
密码:
[root@localhost /]# nano /etc/sysctl.conf
vm.max_map_count=655360
[root@localhost /]# sysctl -p
vm.max_map_count = 655360

1.2.1.2. es2

创建文件

1
2
3
[linux@localhost mydata]$ cp -rf elasticsearch1 elasticsearch2
[linux@localhost mydata]$ ls
elasticsearch1 elasticsearch2 kibana logstash

config/elasticsearch.yml 修改配置信息

1
2
3
4
5
6
7
8
9
10
11
12
13
http.cors.enabled: true
http.cors.allow-origin: "*"
cluster.name: elasticsearch
node.name: 101-es2
node.master: true
node.data: true
node.max_local_storage_nodes: 3
network.host: 0.0.0.0
network.publish_host: 192.168.0.101
http.port: 9201
transport.tcp.port: 9301
discovery.zen.ping.unicast.hosts: ["192.168.0.101:9300", "192.168.0.101:9301","192.168.0.101:9302"]
discovery.zen.minimum_master_nodes: 2

创建es2

1
[linux@localhost /]$ docker run --name es2 -p 9201:9200 -p 9301:9300 -e ES_JAVA_OPTS="-Xms128m -Xmx128m" -v /mydata/elasticsearch2/config/elasticsearch.yml:/usr/share/elasticsearch/config/elasticsearch.yml -v /mydata/elasticsearch2/data:/usr/share/elasticsearch/data -v /mydata/elasticsearch2/plugins:/usr/share/elasticsearch/plugins -d elasticsearch:5.6.11

1.2.1.3. es3

1
2
3
[linux@localhost mydata]$ cp -rf elasticsearch1 elasticsearch3
[linux@localhost mydata]$ ls
elasticsearch1 elasticsearch2 elasticsearch3 kibana logstash

config/elasticsearch.yml 修改配置信息

1
2
3
4
5
6
7
8
9
10
11
12
13
http.cors.enabled: true
http.cors.allow-origin: "*"
cluster.name: elasticsearch
node.name: 101-es3
node.master: true
node.data: true
node.max_local_storage_nodes: 3
network.host: 0.0.0.0
network.publish_host: 192.168.0.101
http.port: 9202
transport.tcp.port: 9302
discovery.zen.ping.unicast.hosts: ["192.168.0.101:9300", "192.168.0.101:9301","192.168.0.101:9302"]
discovery.zen.minimum_master_nodes: 2

创建es3

1
[linux@localhost /]$ docker run --name es3 -p 9202:9200 -p 9302:9300 -e ES_JAVA_OPTS="-Xms128m -Xmx128m" -v /mydata/elasticsearch3/config/elasticsearch.yml:/usr/share/elasticsearch/config/elasticsearch.yml -v /mydata/elasticsearch3/data:/usr/share/elasticsearch/data -v /mydata/elasticsearch3/plugins:/usr/share/elasticsearch/plugins -d elasticsearch:5.6.11

1.2.2. 测试连接

es2 当选

1
2
3
4
5
6
7
8
9
10
curl -XGET 'http://192.168.1.101:9200/_cat/master'
4glKS6mYRO2M1aGwMbSWPQ 172.17.0.4 172.17.0.4 101-es2

curl -XGET 'http://192.168.1.101:9200/_cat/health'
1585690357 21:32:37 elasticsearch green 3 3 2 1 0 0 0 0 - 100.0%

curl -XGET 'http://192.168.1.101:9200/_cat/nodes'
172.17.0.5 48 93 5 0.32 0.96 0.66 mdi - 101-es3
172.17.0.2 55 93 5 0.32 0.96 0.66 mdi - 101-es1
172.17.0.4 58 93 5 0.32 0.96 0.66 mdi * 101-es2

1.2.3. 原理

一个运行中的 Elasticsearch 实例称为一个 节点,而集群是由一个或者多个拥有相同 cluster.name 配置的节点组成, 它们共同承担数据和负载的压力。当有节点加入集群中或者从集群中移除节点时,集群将会重新平均分布所有的数据

当一个节点被选举成为 节点时,它将负责管理集群范围内的所有变更 ,例如增加、删除索引,或者增加、删除节点等。 而主节点并不需要涉及到文档级别的变更和搜索等操作 ,所以当集群只拥有一个主节点的情况下,即使流量的增加它也不会成为瓶颈。 任何节点都可以成为主节点。我们的示例集群就只有一个节点,所以它同时也成为了主节点。

作为用户,我们可以将请求发送到 集群中的任何节点 ,包括主节点。 每个节点都知道任意文档所处的位置,并且能够将我们的请求直接转发到存储我们所需文档的节点。 无论我们将请求发送到哪个节点,它都能负责从各个包含我们所需文档的节点收集回数据,并将最终结果返回給客户端。 Elasticsearch 对这一切的管理都是透明的。

当集群中只有一个节点在运行时,意味着会有一个单点故障问题——没有冗余。 你可以在同一个目录内,完全依照启动第一个节点的方式来启动一个新节点(参考安装并运行 Elasticsearch)。多个节点可以共享同一个目录。

当你在同一台机器上启动了第二个节点时,只要它和第一个节点有同样的 cluster.name 配置,它就会自动发现集群并加入到其中。 但是在不同机器上启动节点的时候,为了加入到同一集群,你需要配置一个可连接到的单播主机列表。

1.2.3.1. 分片

查看分片信息 p主 r副

1
2
3
4
5
6
7
8
9
10
11
12
13
14
GET /_cat/shards

customer 1 p STARTED 0 162b 172.17.0.4 101-es2
customer 1 r STARTED 0 162b 172.17.0.2 101-es1
customer 3 r STARTED 1 3.3kb 172.17.0.5 101-es3
customer 3 p STARTED 1 3.3kb 172.17.0.2 101-es1
customer 4 p STARTED 0 162b 172.17.0.4 101-es2
customer 4 r STARTED 0 162b 172.17.0.2 101-es1
customer 2 r STARTED 0 162b 172.17.0.4 101-es2
customer 2 p STARTED 0 162b 172.17.0.5 101-es3
customer 0 r STARTED 0 162b 172.17.0.5 101-es3
customer 0 p STARTED 0 162b 172.17.0.2 101-es1
.kibana 0 p STARTED 1 3.2kb 172.17.0.4 101-es2
.kibana 0 r STARTED 1 3.2kb 172.17.0.5 101-es3

查看集群信息

1
2
3
4
5
6
7
8
9
10
11
12
13
14
15
16
17
18
19
GET /_cluster/health

{
"cluster_name": "elasticsearch",
"status": "green",
"timed_out": false,
"number_of_nodes": 3,
"number_of_data_nodes": 3,
"active_primary_shards": 6, #es2 3 es3 1 es1 2
"active_shards": 12,
"relocating_shards": 0,
"initializing_shards": 0,
"unassigned_shards": 0,
"delayed_unassigned_shards": 0,
"number_of_pending_tasks": 0,
"number_of_in_flight_fetch": 0,
"task_max_waiting_in_queue_millis": 0,
"active_shards_percent_as_number": 100
}

停止es2

1
2
3
4
5
6
7
8
9
10
11
12
13
14
15
16
17
18
19
20
21
22
23
24
25
26
27
28
29
30
31
32
33
34
35
36
37
38
39
40
41
42
43
44
45
46
47
48
49
50
51
GET _cat/master
xWuBdPbpSMqkCCbIfY07Mg 172.17.0.2 172.17.0.2 101-es1

GET /_cat/shards

customer 1 p STARTED 0 162b 172.17.0.2 101-es1
customer 1 r UNASSIGNED
customer 3 r STARTED 1 3.4kb 172.17.0.5 101-es3
customer 3 p STARTED 1 3.4kb 172.17.0.2 101-es1
customer 4 p STARTED 0 162b 172.17.0.2 101-es1
customer 4 r UNASSIGNED
customer 2 p STARTED 0 162b 172.17.0.5 101-es3
customer 2 r UNASSIGNED
customer 0 r STARTED 0 162b 172.17.0.5 101-es3
customer 0 p STARTED 0 162b 172.17.0.2 101-es1
.kibana 0 p STARTED 1 3.2kb 172.17.0.5 101-es3
.kibana 0 r UNASSIGNED

#重新分配
customer 1 r STARTED 0 162b 172.17.0.5 101-es3
customer 1 p STARTED 0 162b 172.17.0.2 101-es1
customer 3 r STARTED 1 3.4kb 172.17.0.5 101-es3
customer 3 p STARTED 1 3.4kb 172.17.0.2 101-es1
customer 4 r STARTED 0 162b 172.17.0.5 101-es3
customer 4 p STARTED 0 162b 172.17.0.2 101-es1
customer 2 p STARTED 0 162b 172.17.0.5 101-es3
customer 2 r STARTED 0 162b 172.17.0.2 101-es1
customer 0 r STARTED 0 162b 172.17.0.5 101-es3
customer 0 p STARTED 0 162b 172.17.0.2 101-es1
.kibana 0 p STARTED 1 3.2kb 172.17.0.5 101-es3
.kibana 0 r STARTED 1 3.2kb 172.17.0.2 101-es1


GET /_cluster/health
{
"cluster_name": "elasticsearch",
"status": "green",
"timed_out": false,
"number_of_nodes": 2,
"number_of_data_nodes": 2,
"active_primary_shards": 6,
"active_shards": 12,
"relocating_shards": 0,
"initializing_shards": 0,
"unassigned_shards": 0,
"delayed_unassigned_shards": 0,
"number_of_pending_tasks": 0,
"number_of_in_flight_fetch": 0,
"task_max_waiting_in_queue_millis": 0,
"active_shards_percent_as_number": 100
}

分片原理

)

当第二个节点加入到集群后,3个 副本分片 将会分配到这个节点上——每个主分片对应一个副本分片。 这意味着当集群内任何一个节点出现问题时,我们的数据都完好无损。

所有新近被索引的文档都将会保存在主分片上,然后被并行的复制到对应的副本分片上。这就保证了我们既可以从主分片又可以从副本分片上获得文档。

cluster-health 现在展示的状态为 green ,这表示所有6个分片(包括3个主分片和3个副本分片)都在正常运行。

1.2.4. 集群健康

GET /_cluster/health

status 字段指示着当前集群在总体上是否工作正常。它的三种颜色含义如下:

green 所有的主分片和副本分片都正常运行。

yellow 所有的主分片都正常运行,但不是所有的副本分片都正常运行。

red 有主分片没能正常运行。

1.2.4.1. 水平扩容

三个节点的集群为了分散负载而对分片进行重新分配

P0的副本存在R0中,P1的副本存在R1中,P2的副本存在R2中,即使node3 挂了,数据仍完整

读操作——搜索和返回数据——可以同时被主分片 或 副本分片所处理,所以当你拥有越多的副本分片时,也将拥有越高的吞吐量。

在运行中的集群上是可以动态调整副本分片数目的, 我们可以按需伸缩集群.让我们把副本数从默认的 1 增加到 2

1
2
3
4
PUT /blogs/_settings
{
"number_of_replicas" : 2
}

关闭Node 1 的同时也失去了主分片 1 和 2 ,并且在缺失主分片的时候索引也不能正常工作。 如果此时来检查集群的状况,我们看到的状态将会为 red :不是所有主分片都在正常工作。

幸运的是,在其它节点上存在着这两个主分片的完整副本, 所以新的主节点立即将这些分片在 Node 2 和 Node 3 上对应的副本分片提升为主分片, 此时集群的状态将会为 yellow(不是green是因为我们之前设置主分片存在两个副本,而现在只剩一个了) 。 这个提升主分片的过程是瞬间发生的,如同按下一个开关一般

1.2.4.2. 脑裂问题

集群中不同的节点对于master的选择出现了分歧,出现了多个master竞争,导致主分片和副本的识别也发生了分歧,对一些分歧中的分片标识为了坏片。

脑裂问题可能的成因 - 主不能工作了就得选

  1. 网络问题:集群间的网络延迟导致一些节点访问不到master,认为master挂掉了从而选举出新的master,并对master上的分片和副本标红,分配新的主分片

  2. 节点负载:主节点的角色既为master又为data,访问量较大时可能会导致ES停止响应造成大面积延迟,此时其他节点得不到主节点的响应认为主节点挂掉了,会重新选取主节点。

  3. 内存回收:data节点上的ES进程占用的内存较大,引发JVM的大规模内存回收,造成ES进程失去响应

脑裂问题解决方案

  1. 减少误判:discovery.zen.ping_timeout节点状态的响应时间,默认为3s,可以适当调大,如果master在该响应时间的范围内没有做出响应应答,判断该节点已经挂掉了。调大参数(如6s,discovery.zen.ping_timeout:6),可适当减少误判。

  2. 选举触发 discovery.zen.minimum_master_nodes:1。

    discovery.zen.minimum_master_nodes(默认是1):这个参数控制的是,一个节点需要看到的具有master节点资格的最小数量,然后才能在集群中做操作。官方的推荐值是(N/2)+1,其中N是具有master资格的节点的数量(我们的情况是3,因此这个参数设置为2,但对于只有2个节点的情况,设置为2就有些问题了,一个节点DOWN掉后,你肯定连不上2台服务器了,这点需要注意)。

    增大该参数,当该值为2时,我们可以设置master的数量为3,这样,挂掉一台,其他两台都认为主节点挂掉了,才进行主节点选举。

  3. 角色分离:即master节点与data节点分离,限制角色

    主节点配置为: node.master: true ##作为master节点

    ​ node.data: false ##不作为存储数据节点

    从节点配置为: node.master: false

    ​ node.data: true

最终考虑到资源有限,解决方案如下:

增加一台物理机,这样,一共有了三台物理机。在这三台物理机上,搭建了6个ES的节点,三个data节点,三个master节点(每台物理机分别起了一个data和一个master),3个master节点,目的是达到(n/2)+1等于2的要求,这样挂掉一台master后(不考虑data),n等于2,满足参数,其他两个master节点都认为master挂掉之后开始重新选举

1.3. Kibana5.6.11

1
2
3
4
5
6
7
8
[root@192 /]# docker pull kibana:5.6.11

[root@192 /]# docker run --name kibana -v /mydata/kibana/config/kibana.yml:/usr/share/kibana/config/kibana.yml -p 5601:5601 -d kibana:5.6.11

25d1bd1a0531c0aec95e7885adf82dc14adbb71df43d4dbc15d6fee7cce58e34
docker: Error response from daemon: driver failed programming external connectivity on endpoint kibana (84808062bec07bb507621f089d0f31d73cc7c3f57402cb6c61444cffddbcc14d): (iptables failed: iptables --wait -t nat -A DOCKER -p tcp -d 0/0 --dport 5601 -j DNAT --to-destination 172.17.0.3:5601 ! -i docker0: iptables: No chain/target/match by that name.
(exit status 1)).
[root@192 /]#

重启docker??

1
2
3
4
5
6
7
8
9
10
11
12
[root@192 /]# 
[root@192 /]# systemctl restart docker
[root@192 /]#
[root@192 /]# docker ps -a
CONTAINER ID IMAGE COMMAND CREATED STATUS PORTS NAMES
25d1bd1a0531 kibana:5.6.11 "/docker-entrypoint.…" About a minute ago Created kibana
760ba5e8259c elasticsearch:5.6.11 "/docker-entrypoint.…" 21 minutes ago Exited (143) 7 seconds ago elasticsearch
[root@192 /]# docker start 25d1bd1a0531
25d1bd1a0531
[root@192 /]# docker start 760ba5e8259c
760ba5e8259c
[root@192 /]#

访问 http://192.168.0.101:5601/

修改配置文件 原kibana.yml

1
2
3
4
5
6
7
8
9
10
11
12
13
14
15
16
17
18
19
20
21
22
23
24
25
26
27
28
29
30
31
32
33
34
35
36
37
38
39
40
41
42
43
44
45
46
47
48
49
50
51
52
53
54
55
56
57
58
59
60
61
62
63
64
65
66
67
68
69
70
71
72
73
74
75
76
77
78
79
80
81
82
83
84
85
86
87
88
89
90
91
92
93
94
95
96
97
98
99
100
101
102
103
104
# Kibana is served by a back end server. This setting specifies the port to use.
#server.port: 5601

# Specifies the address to which the Kibana server will bind. IP addresses and host names are both valid values.
# The default is 'localhost', which usually means remote machines will not be able to connect.
# To allow connections from remote users, set this parameter to a non-loopback address.
#server.host: "localhost"

# Enables you to specify a path to mount Kibana at if you are running behind a proxy. This only affects
# the URLs generated by Kibana, your proxy is expected to remove the basePath value before forwarding requests
# to Kibana. This setting cannot end in a slash.
#server.basePath: ""

# The maximum payload size in bytes for incoming server requests.
#server.maxPayloadBytes: 1048576

# The Kibana server's name. This is used for display purposes.
#server.name: "your-hostname"

# The URL of the Elasticsearch instance to use for all your queries.
#elasticsearch.url: "http://localhost:9200"

# When this setting's value is true Kibana uses the hostname specified in the server.host
# setting. When the value of this setting is false, Kibana uses the hostname of the host
# that connects to this Kibana instance.
#elasticsearch.preserveHost: true

# Kibana uses an index in Elasticsearch to store saved searches, visualizations and
# dashboards. Kibana creates a new index if the index doesn't already exist.
#kibana.index: ".kibana"

# The default application to load.
#kibana.defaultAppId: "discover"

# If your Elasticsearch is protected with basic authentication, these settings provide
# the username and password that the Kibana server uses to perform maintenance on the Kibana
# index at startup. Your Kibana users still need to authenticate with Elasticsearch, which
# is proxied through the Kibana server.
#elasticsearch.username: "user"
#elasticsearch.password: "pass"

# Enables SSL and paths to the PEM-format SSL certificate and SSL key files, respectively.
# These settings enable SSL for outgoing requests from the Kibana server to the browser.
#server.ssl.enabled: false
#server.ssl.certificate: /path/to/your/server.crt
#server.ssl.key: /path/to/your/server.key

# Optional settings that provide the paths to the PEM-format SSL certificate and key files.
# These files validate that your Elasticsearch backend uses the same key files.
#elasticsearch.ssl.certificate: /path/to/your/client.crt
#elasticsearch.ssl.key: /path/to/your/client.key

# Optional setting that enables you to specify a path to the PEM file for the certificate
# authority for your Elasticsearch instance.
#elasticsearch.ssl.certificateAuthorities: [ "/path/to/your/CA.pem" ]

# To disregard the validity of SSL certificates, change this setting's value to 'none'.
#elasticsearch.ssl.verificationMode: full

# Time in milliseconds to wait for Elasticsearch to respond to pings. Defaults to the value of
# the elasticsearch.requestTimeout setting.
#elasticsearch.pingTimeout: 1500

# Time in milliseconds to wait for responses from the back end or Elasticsearch. This value
# must be a positive integer.
#elasticsearch.requestTimeout: 30000

# List of Kibana client-side headers to send to Elasticsearch. To send *no* client-side
# headers, set this value to [] (an empty list).
#elasticsearch.requestHeadersWhitelist: [ authorization ]

# Header names and values that are sent to Elasticsearch. Any custom headers cannot be overwritten
# by client-side headers, regardless of the elasticsearch.requestHeadersWhitelist configuration.
#elasticsearch.customHeaders: {}

# Time in milliseconds for Elasticsearch to wait for responses from shards. Set to 0 to disable.
#elasticsearch.shardTimeout: 0

# Time in milliseconds to wait for Elasticsearch at Kibana startup before retrying.
#elasticsearch.startupTimeout: 5000

# Specifies the path where Kibana creates the process ID file.
#pid.file: /var/run/kibana.pid

# Enables you specify a file where Kibana stores log output.
#logging.dest: stdout

# Set the value of this setting to true to suppress all logging output.
#logging.silent: false

# Set the value of this setting to true to suppress all logging output other than error messages.
#logging.quiet: false

# Set the value of this setting to true to log all events, including system usage information
# and all requests.
#logging.verbose: false

# Set the interval in milliseconds to sample system and process performance
# metrics. Minimum is 100ms. Defaults to 5000.
#ops.interval: 5000

# The default locale. This locale can be used in certain circumstances to substitute any missing
# translations.
#i18n.defaultLocale: "en"

创建 /mydata/kibana/config/kibana.yml

kibana配置文件挂载到本地

1
2
3
4
5
6
7
8
9
10
11
12
13
14
15
16
17
18
19
20
21
22
23
24
25
26
27
28
29
30
31
32
33
[root@192 /]# mkdir -p /mydata/kibana/config
[root@192 /]# cd /mydata/kibana/config
[root@192 config]# nano kibana.yml
bash: nano: 未找到命令
[root@192 config]# yum install nano
[root@192 config]# nano kibana.yml

#############################################
server.port: 5601

server.host: "0.0.0.0"

elasticsearch.url: "http://192.168.0.101:9200"

elasticsearch.requestTimeout: 90000

i18n.defaultLocale: "zh-CN"
##################################################


[root@192 config]# docker rm 25d1bd1a0531
25d1bd1a0531
[root@192 config]# docker run --name kibana -v /mydata/kibana/config/kibana.yml:/usr/share/kibana/config/kibana.yml -p 5601:5601 -d kibana:5.6.11
7122d84209e4d082dc6e0e18065567eb0bbfd5e4aa3017b3ff8d8457c217b66b

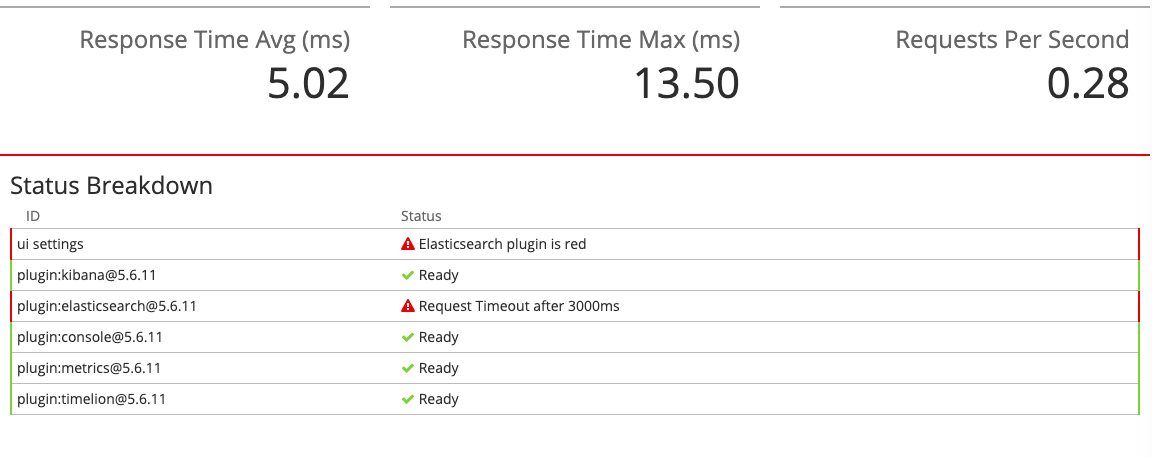
[root@192 config]# docker ps
CONTAINER ID IMAGE COMMAND CREATED STATUS PORTS NAMES
7122d84209e4 kibana:5.6.11 "/docker-entrypoint.…" 25 minutes ago Up 10 minutes 0.0.0.0:5601->5601/tcp kibana
760ba5e8259c elasticsearch:5.6.11 "/docker-entrypoint.…" About an hour ago Up 49 minutes 0.0.0.0:9200->9200/tcp, 0.0.0.0:9300->9300/tcp elasticsearch
[root@192 config]#
[root@192 config]#
[root@192 config]# docker logs 7122d84209e4
"tags":["status","ui settings","info"],"pid":9,"state":"green","message":"Status changed from yellow to green - Ready","prevState":"yellow","prevMsg":"Elasticsearch plugin is yellow"}

1.4. logstash5.6.11

1
2
3
4
5
6
7
8
9
10
11
12
13
14
15
16
17
18
19
20
21
22
23
24
25
26
27
28
29
30
31
32
33
34
35
36
37
[root@192 config]# docker pull logstash:5.6.11
[root@192 config]# mkdir -p /mydata/logstash
[root@192 config]# cd /mydata/logstash
[root@192 logstash]# nano logstash.conf

#################################################
input {
tcp {
port => 4560
codec => json_lines
}
}

output {
elasticsearch {
hosts => ["192.168.0.101:9200"]
index => "applog"
#user => "elastic"
#password => "changeme"
}
stdout{ codec => rubydebug}
}
####################################################

[root@192 logstash]#
[root@192 logstash]# pwd
/mydata/logstash
[root@192 logstash]# docker run --name logstash -p 4560:4560 -v /mydata/logstash/logstash.conf:/etc/logstash.conf --link elasticsearch:elasticsearch -d logstash:5.6.11 logstash -f /etc/logstash.conf
c7473e2145bc7478835f08b08caf8134b126899a4031b78baf5b234c732bd7fa
[root@192 logstash]#
[root@192 logstash]#
[root@192 logstash]# docker ps
CONTAINER ID IMAGE COMMAND CREATED STATUS PORTS NAMES
c7473e2145bc logstash:5.6.11 "/docker-entrypoint.…" 6 seconds ago Up 3 seconds 0.0.0.0:4560->4560/tcp logstash
7122d84209e4 kibana:5.6.11 "/docker-entrypoint.…" About an hour ago Up 49 minutes 0.0.0.0:5601->5601/tcp kibana
760ba5e8259c elasticsearch:5.6.11 "/docker-entrypoint.…" 2 hours ago Up 2 hours 0.0.0.0:9200->9200/tcp, 0.0.0.0:9300->9300/tcp elasticsearch
[root@192 logstash]#

2. linux

2.1. ElasticSearch 存储和检索数据

https://www.elastic.co/cn/downloads/elasticsearch

elasticsearch只能用非root启动

拷贝至/usr/local/elasticsearch-7.6.1

编译 elasticsearch.yml

1
2
3
4
5
6
7
8
9
10
11
[root@192 Downloads]# tar zxvf elasticsearch-7.6.1-linux-x86_64.tar.gz
[root@192 Downloads]# ls
elasticsearch-7.6.1 elasticsearch-7.6.1-linux-x86_64.tar.gz tomcat-users.xml
[root@192 Downloads]# cp -rf elasticsearch-7.6.1 /usr/local/elasticsearch-7.6.1
[root@192 Downloads]# cd /usr/local/elasticsearch-7.6.1
[root@192 elasticsearch-7.6.1]# ls
bin config jdk lib LICENSE.txt logs modules NOTICE.txt plugins README.asciidoc
[root@192 elasticsearch-7.6.1]# cd config
[root@192 config]# ls
elasticsearch.yml jvm.options log4j2.properties role_mapping.yml roles.yml users users_roles
[root@192 config]# nano elasticsearch.yml

elasticsearch.yml

1
2
3
4
5
6
7
8
9
10
11
12
13
14
15
16
17
18
19
20
21
22
23
24
25
26
27
28
29
30
31
32
33
34
35
36
37
38
39
40
41
42
43
44
45
46
47
48
49
50
51
cluster.name: es-linux
#
# ------------------------------------ Node ------------------------------------
#
# Use a descriptive name for the node:
#
node.name: node-linux
#
# Add custom attributes to the node:
#
# node.attr.rack: r1
#
# ----------------------------------- Paths ------------------------------------
#
# Path to directory where to store the data (separate multiple locations by comma):
#
path.data: /usr/local/elasticsearch-7.6.1/data
#
# Path to log files:
#
path.logs: /usr/local/elasticsearch-7.6.1/logs
#
# ----------------------------------- Memory -----------------------------------
#
# Lock the memory on startup:
#
bootstrap.memory_lock: false
bootstrap.system_call_filter: false
# ---------------------------------- Network -----------------------------------
#
# Set the bind address to a specific IP (IPv4 or IPv6):
#
network.host: 0.0.0.0
#
# Set a custom port for HTTP:
#
http.port: 9200
#
# --------------------------------- Discovery ----------------------------------
#
# Pass an initial list of hosts to perform discovery when this node is started:
# The default list of hosts is ["127.0.0.1", "[::1]"]
#
discovery.zen.ping.unicast.hosts: ["127.0.0.1","192.168.0.100","192.168.0.112"]
#
# Bootstrap the cluster using an initial set of master-eligible nodes:
#
cluster.initial_master_nodes: ["es-linux"]
#
# For more information, consult the discovery and cluster formation module documentation.
#

jvm.options

1
2
-Xms256m
-Xmx256m

创建用户和权限

1
2
3
4
[root@192 bin]# adduser elasticsearch
[root@192 bin]# passwd elasticsearch

[root@192 local]# chown -R elasticsearch:elasticsearch elasticsearch-7.6.1

ERROR Unable to invoke factory method in class org.apache.logging.log4j.core.appender.RollingFileAppender for element RollingFile

1
[root@192 bin]# yum install -y log4j

max file descriptors [4096] for elasticsearch process likely too low, increase to at least [65536]

1
2
3
4
5
6
[root@192 bin]# nano /etc/security/limits.conf

* soft nofile 65536
* hard nofile 65536
* soft nproc 4096
* hard nproc 4096

max virtual memory areas vm.max_map_count [65530] is too low, increase to at least [262144]

1
2
3
4
5
nano /etc/sysctl.conf

vm.max_map_count=262144

sysctl -p

运行

1
2
[root@192 bin]# su elasticsearch
[elasticsearch@192 bin]$ ./elasticsearch

future versions of Elasticsearch will require Java 11; 运行es自带jdk

注释原有java_home的判断

1
2
3
4
5
6
7
8
9
10
11
12
13
14
vi elasticsearch-env

#if [ ! -z "$JAVA_HOME" ]; then
# JAVA="$JAVA_HOME/bin/java"
# JAVA_TYPE="JAVA_HOME"
#else
if [ "$(uname -s)" = "Darwin" ]; then
# macOS has a different structure
JAVA="$ES_HOME/jdk.app/Contents/Home/bin/java"
else
JAVA="$ES_HOME/jdk/bin/java"
fi
JAVA_TYPE="bundled jdk"
#fi

重新运行 ./elasticsearch -d

http://192.168.0.113:9200/

2.2. Logstash 收集数据保存到es

https://www.elastic.co/cn/downloads/logstash 解压后进入config文件夹下

nano config/logstash-sample.conf

1
2
3
4
5
6
7
8
9
10
11
12
13
14
15
16
17
18
# Sample Logstash configuration for creating a simple
# Beats -> Logstash -> Elasticsearch pipeline.

input {
beats {
port => 5044
}
}

output {
elasticsearch {
hosts => ["localhost:9200"]
index => "%{[@metadata][beat]}-%{[@metadata][version]}-%{+YYYY.MM.dd}"
#user => "elastic"
#password => "changeme"
}
}

logstash-sample.conf中的内容改为

1
2
3
4
5
6
7
8
9
10
11
12
13
14
15
16
17
input {
tcp {
port => 4560
codec => json_lines
}
}

output {
elasticsearch {
hosts => ["192.168.0.113:9200"]
index => "applog"
#user => "elastic"
#password => "changeme"
}
stdout{ codec => rubydebug}
}

安装json_lines

1
2
./logstash-plugin list|grep json-lines
./logstash-plugin install logstash-codec-json_lines

2.3. Kibana 可视化界面

https://www.elastic.co/cn/downloads/kibana

config/kibana.yml

1
2
3
4
5
6
7
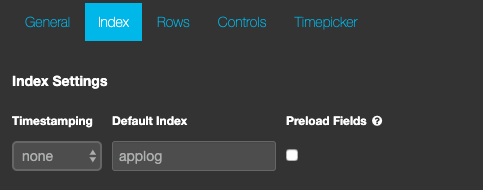
server.port: 5601

# To allow connections from remote users
server.host: "192.168.0.100"

# The URLs of the Elasticsearch instances to use for all your queries.
elasticsearch.hosts: ["http://192.168.0.100:9200"]

虚拟机中ELK全开+本机Intellij项目运行 笔记本完全卡死了。。。故采用树莓派安装ELK

3. 树莓派

https://zhuanlan.zhihu.com/p/23111516

3.1. elasticsearch-1.0.1

https://www.elastic.co/cn/downloads/past-releases/elasticsearch-1-0-1

1
2
3
4
5
6
7
8
9
10
11
12
13
14
15
16
17
18
19
20
21
22
23
24
pi@pi:/usr/local $ cd es1
pi@pi:/usr/local/es1 $ ls
bin config lib LICENSE.txt NOTICE.txt README.textile
root@pi:/usr/local/es1# cd config
root@pi:/usr/local/es1/config# nano elasticsearch.yml
# 集群名字,如果要搭集群的话,同个网段内的Elasticsearch应用集群名取得一样就行了,应用会自动广播组成集群的,非常方便
cluster.name: es-pi
# 节点的名称,这个应用的节点名字叫啥,用于区分同个集群里的不同节点
node.name: "node-pi"
# 是否为主节点,一个集群里必须有一个主节点,也只能有一个主节点。当出现一个主节点后,其他master: true的节点都只会成为备用主节点,只有当之前的主节点挂了的时候其他备用的节点才会顶上来。
node.master: true
# 是否是数据节点,一个集群必须要有至少一个数据节点来存储数据
node.data: true
# 默认这个集群中每个索引的分片数量。Elasticsearch中的数据都是存储在索引(index)中的(不同于sql数据库中的索引的概念),每个索引会被分成多个分片到不同的数据节点中进行保存。这就是一个分布式文件数据库的概念
index.number_of_shards: 1
# 默认这个集群中每个分片的副本数量。Elasticsearch中的每个分片都会产生等同于该配置数量的副本,副本分片一般不会与主分片存储在相同的主机节点中,当有主机挂掉的时候,该节点上的分片就丢失了,这时,如果设置了副本分片(相当于备份),那就会保证索引的完整性。如果是单节点没有集群的话,这里配置0就可以了
index.number_of_replicas: 0
# 节点中数据存储的路径,这条不配也没事,默认存储在Elasticsearch文件夹中
# path.data: /path/to/data

root@pi:/usr/local/es1/bin# nano elasticsearch.in.sh
root@pi:/usr/local/es1/bin#
ES_MIN_MEM=128m
ES_MAX_MEM=128m

3.2. Kibana-3.0.0

https://www.elastic.co/cn/downloads/past-releases/kibana-3-0-0

1
2
3
4
5
6
root@pi:/home/pi# cd /usr/local/kibana
root@pi:/usr/local/kibana# ls
app build.txt config.js css favicon.ico font img index.html LICENSE.md README.md vendor
root@pi:/usr/local/kibana# nano config.js

elasticsearch: "http://192.168.0.112:9200",

kibana需要挂载到tomcat或nignx中显示

整个文件添加到tomcat的webapps文件夹下

1
2
3
4
root@pi:/usr/local/tomcat8/webapps# cp -rf /usr/local/kibana /usr/local/tomcat8/webapps
root@pi:/usr/local/tomcat8/webapps# ls
docs examples host-manager kibana manager ROOT

运行tomcat http://192.168.0.112:8080/kibana/index.html

根据索引查找

3.3. logstash-2.0.0

https://www.elastic.co/cn/downloads/past-releases/logstash-2-0-0

1
2
3
4
5
6
7
8
9
root@pi:/home/pi/Downloads# tar zxvf logstash-2.0.0.tar.gz
root@pi:/home/pi/Downloads# cp -rf logstash-2.0.0 /usr/local/logstash
root@pi:/home/pi# cd /usr/local/logstash
root@pi:/usr/local/logstash# ls
bin CHANGELOG.md CONTRIBUTORS Gemfile Gemfile.jruby-1.9.lock lib LICENSE logstash.conf NOTICE.TXT vendor
root@pi:/usr/local/logstash# cd bin
root@pi:/usr/local/logstash/bin# ls
logstash logstash.bat logstash.lib.sh plugin plugin.bat rspec rspec.bat setup.bat
root@pi:/usr/local/logstash/bin# ./logstash

3.3.1. 运行出错 libjffi-1.2.so

java.lang.UnsatisfiedLinkError: /usr/local/logstash/vendor/jruby/lib/jni/arm-Linux/libjffi-1.2.so: /usr/local/logstash/vendor/jruby/lib/jni/arm-Linux/libjffi-1.2.so: 无法打开共享对象文件: 没有那个文件或目录

https://discuss.elastic.co/t/logstash-7-x-on-raspberry-pi-4/205348

安装texinfo,jruby

1
2
root@pi:/usr/local/logstash/bin# apt-get install apt-transport-https jruby -y
root@pi:/usr/local/logstash/bin# apt-get install texinfo build-essential ant git -y

perl-base 5.24.1-3+deb9u6 [无候选版本]

安装perl

https://packages.debian.org/buster/arm64/perl/download

1
2
3
4
5
6
7
root@pi:/usr/local/logstash/bin# nano /etc/apt/sources.list

#镜像
deb http://ftp.cn.debian.org/debian buster main

#升级
root@pi:/usr/local/logstash/bin# apt-get install update

W: GPG 错误:http://ftp.us.debian.org/debian stretch Release: 由于没有公钥,无W: GPG 错误:http://ftp.us.debian.org/debian stretch Release: 由于没有公钥,无法验证下列签名 NO_PUBKEY << key>>

1
sudo apt-key adv --keyserver keyserver.ubuntu.com --recv-keys <<key>>

W: 目标 Packages (main/binary-armhf/Packages) 在 /etc/apt/sources.list.d/elastic-7.x.list:1和 /etc/apt/sources.list.d/elastic-7.x.list:2 中被配置了多次

1
2
3
4
5
6
7
8
root@pi:/usr/local/logstash/bin# cd /etc/apt/sources.list.d
root@pi:/etc/apt/sources.list.d# ls
docker.list elastic-7.x.list raspi.list
root@pi:/etc/apt/sources.list.d# rm -r elastic-7.x.list
root@pi:/etc/apt/sources.list.d# sudo apt-get update
root@pi:/etc/apt/sources.list.d#
root@pi:/etc/apt/sources.list.d# apt-get install perl

依旧perl-base 5.24.1-3+deb9u6 [无候选版本]

手动安装

1
2
3
4
5
6
7
root@pi:/home/pi/Downloads# wget http://www.cpan.org/src/5.0/perl-5.24.1.tar.gz
root@pi:/home/pi/Downloads# tar zxvf perl-5.24.1.tar.gz
root@pi:/home/pi/Downloads# cp -rf perl-5.24.1 /usr/local/perl-5.24.1
root@pi:/home/pi/Downloads# cd /usr/local/perl-5.24.1
root@pi:/usr/local/perl-5.24.1# ./Configure -des -Dprefix=/usr
root@pi:/usr/local/perl-5.24.1# make && make install
root@pi:/usr/local/perl-5.24.1# perl -v

编译jffi库

1
2
3
root@pi:/usr/local# git clone https://github.com/jnr/jffi 9
root@pi:/usr/local# cd jffi/
root@pi:/usr/local/jffi# ant jar

替换jffi

将/usr/local/logstash/vendor/jruby/lib/jni/arm-Linux下的libjffi-1.2.so 替换为/usr/local/jffi/build/jni/下的libjffi-1.2.so

1
2
3
4
5
6
7
8
9
10
11
12
13
14
15
16
17
18
19
20
21
22
23
24
25
26
27
28
29
30
31
32
33
34
35
36
37
38
39
40
41
42
43
44
45
46
47
48
49
50
51
52
53
54
55
56
57
58
59
60
61
62
63
64
65
66
67
68
69
70
71
72
73
74
75
76
77
78
79
80
81
82
83
84
85
root@pi:/usr/local/jffi# cd /usr/local/logstash/vendor/jruby/lib/jni/arm-Linux
root@pi:/usr/local/logstash/vendor/jruby/lib/jni/arm-Linux# ls
libjffi-1.2.so
root@pi:/usr/local/logstash/vendor/jruby/lib/jni/arm-Linux# cd /usr/local/jffi/build/jni/
root@pi:/usr/local/jffi/build/jni# ls
com_kenai_jffi_Foreign.h com_kenai_jffi_Foreign_InValidInstanceHolder.h com_kenai_jffi_ObjectBuffer.h jffi libjffi-1.2.so
com_kenai_jffi_Foreign_InstanceHolder.h com_kenai_jffi_Foreign_ValidInstanceHolder.h com_kenai_jffi_Version.h libffi-arm-linux
root@pi:/usr/local/jffi/build/jni# cd /usr/local/logstash/vendor/jruby/lib/jni/arm-Linux
root@pi:/usr/local/logstash/vendor/jruby/lib/jni/arm-Linux# mv libjffi-1.2.so libjffi-1.2.so.old
root@pi:/usr/local/logstash/vendor/jruby/lib/jni/arm-Linux# cd /usr/local/jffi/build/jni/
root@pi:/usr/local/jffi/build/jni# cp libjffi-1.2.so /usr/local/logstash/vendor/jruby/lib/jni/arm-Linux/libjffi-1.2.so
root@pi:/usr/local/jffi/build/jni# cd /usr/local/logstash/vendor/jruby/lib/jni/arm-Linux
root@pi:/usr/local/logstash/vendor/jruby/lib/jni/arm-Linux# ls
libjffi-1.2.so libjffi-1.2.so.old
root@pi:/usr/local/logstash/vendor/jruby/lib/jni/arm-Linux#
root@pi:/usr/local/logstash/vendor/jruby/lib/jni/arm-Linux# cd /usr/local/logstash/bin
root@pi:/usr/local/logstash/bin# ./logstash
io/console not supported; tty will not be manipulated
No command given

Usage: logstash <command> [command args]
Run a command with the --help flag to see the arguments.
For example: logstash agent --help

Available commands:
agent - runs the logstash agent
version - emits version info about this logstash
root@pi:/usr/local/logstash/bin# ls
logstash logstash.bat logstash.lib.sh plugin plugin.bat rspec rspec.bat setup.bat
root@pi:/usr/local/logstash/bin# logstash
bash: logstash:未找到命令
root@pi:/usr/local/logstash/bin# ./logstash --help
io/console not supported; tty will not be manipulated
Usage:
/bin/logstash agent [OPTIONS]

Options:
-f, --config CONFIG_PATH Load the logstash config from a specific file
or directory. If a directory is given, all
files in that directory will be concatenated
in lexicographical order and then parsed as a
single config file. You can also specify
wildcards (globs) and any matched files will
be loaded in the order described above.
-e CONFIG_STRING Use the given string as the configuration
data. Same syntax as the config file. If no
input is specified, then the following is
used as the default input:
"input { stdin { type => stdin } }"
and if no output is specified, then the
following is used as the default output:
"output { stdout { codec => rubydebug } }"
If you wish to use both defaults, please use
the empty string for the '-e' flag.
(default: "")
-w, --filterworkers COUNT Sets the number of filter workers to run.
(default: 2)
-l, --log FILE Write logstash internal logs to the given
file. Without this flag, logstash will emit
logs to standard output.
-v Increase verbosity of logstash internal logs.
Specifying once will show 'informational'
logs. Specifying twice will show 'debug'
logs. This flag is deprecated. You should use
--verbose or --debug instead.
--quiet Quieter logstash logging. This causes only
errors to be emitted.
--verbose More verbose logging. This causes 'info'
level logs to be emitted.
--debug Most verbose logging. This causes 'debug'
level logs to be emitted.
-V, --version Emit the version of logstash and its friends,
then exit.
-p, --pluginpath PATH A path of where to find plugins. This flag
can be given multiple times to include
multiple paths. Plugins are expected to be
in a specific directory hierarchy:
'PATH/logstash/TYPE/NAME.rb' where TYPE is
'inputs' 'filters', 'outputs' or 'codecs'
and NAME is the name of the plugin.
-t, --configtest Check configuration for valid syntax and then exit.
-h, --help print help
root@pi:/usr/local/logstash/bin#

运行logstash脚本

1
2
3
4
5
6
7
8
9
10
11
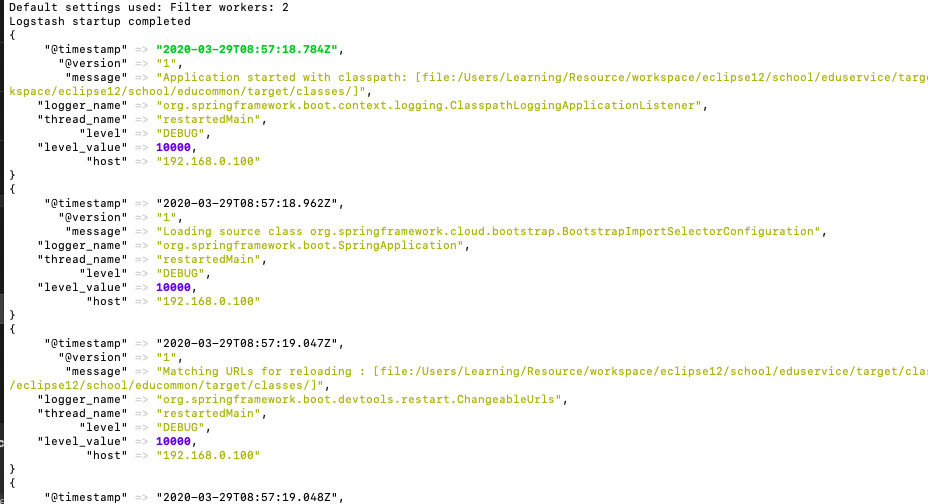
root@pi:/usr/local/logstash/bin# ./logstash -e 'input{stdin{}}output{stdout{codec=>rubydebug}}'
io/console not supported; tty will not be manipulated
Default settings used: Filter workers: 2
Logstash startup completed
Hello World
{
"message" => "Hello World",
"@version" => "1",
"@timestamp" => "2020-03-29T08:28:52.594Z",
"host" => "pi"
}

配置文件

1
2
3
4
5
6
7
8
9
10
11
12
13
14
15
16
17
18
19
20
21
root@pi:/usr/local/logstash/bin#cd /usr/local/logstash
root@pi:/usr/local/logstash# ls
bin CHANGELOG.md CONTRIBUTORS Gemfile Gemfile.jruby-1.9.lock lib LICENSE logstash.conf NOTICE.TXT vendor
root@pi:/usr/local/logstash# nano logstash.conf

input {
tcp {
port => 4560
codec => json_lines
}
}

output {
elasticsearch {
hosts => ["192.168.0.112:9200"]
index => "applog"
#user => "elastic"
#password => "changeme"
}
stdout{ codec => rubydebug}
}

开放4560端口

1
2
root@pi:/usr/local/logstash# iptables -I INPUT -i eth0 -p tcp --dport 4560 -j ACCEPT
root@pi:/usr/local/logstash# iptables -I OUTPUT -o eth0 -p tcp --sport 4560 -j ACCEPT

3.4. 创建Maven依赖

1
2
3
4
5
6
<!-- https://mvnrepository.com/artifact/net.logstash.logback/logstash-logback-encoder -->
<dependency>
<groupId>net.logstash.logback</groupId>
<artifactId>logstash-logback-encoder</artifactId>
<version>6.3</version>
</dependency>

3.5. logback-spring.xml

1
2
3
4
5
6
7
8
9
10
11
12
13
14
15
16
17
18
19
20
21
22
23
24
25
26
27
28
29
30
31
32
33
34
<?xml version="1.0" encoding="UTF-8"?>
<!DOCTYPE configuration>
<configuration>
<include resource="org/springframework/boot/logging/logback/base.xml"/>
<include resource="org/springframework/boot/logging/logback/defaults.xml"/>
<include resource="org/springframework/boot/logging/logback/console-appender.xml"/>
<!--应用名称-->
<property name="APP_NAME" value="edu-service"/>
<!--日志文件保存路径-->
<property name="LOG_FILE_PATH" value="edu-service"/>
<contextName>${APP_NAME}</contextName>
<!--每天记录日志到文件appender-->
<appender name="FILE" class="ch.qos.logback.core.rolling.RollingFileAppender">
<rollingPolicy class="ch.qos.logback.core.rolling.TimeBasedRollingPolicy">
<fileNamePattern>${LOG_FILE_PATH}/${APP_NAME}-%d{yyyy-MM-dd}.log</fileNamePattern>
<maxHistory>30</maxHistory>
</rollingPolicy>
<encoder>
<pattern>${FILE_LOG_PATTERN}</pattern>
</encoder>
</appender>
<!--输出到logstash的appender-->
<appender name="LOGSTASH" class="net.logstash.logback.appender.LogstashTcpSocketAppender">
<destination>192.168.0.100:4560</destination>
<encoder charset="UTF-8" class="net.logstash.logback.encoder.LogstashEncoder"/>
</appender>

<!--日志级别 DEBUG-INFO-WARN-ERROR -->
<root level="DEBUG">
<appender-ref ref="CONSOLE"/>
<appender-ref ref="FILE"/>
<appender-ref ref="LOGSTASH"/>
</root>
</configuration>

4. 运行SpringBoot

http://192.168.0.112:8080/kibana/index.html#/dashboard/file/logstash.json

树莓派终端

运行一次就两千多个数据

本文结束  感谢您的阅读