1
2
3
4
5
6
7
8
9
10
11
12
13
14
15
16
17
18
19
20
21
22
23
24
25
26
27
28
29
30
31
32
33
34
35
36
37
38
39
40
41
42
43
44
45
46
47
48
49
50
51
52
53
54
55
56
57
58
59
60
61
62
63
64
65
66
67
68
69
70
71
72
73
74
75
76
77
78
79
80
81
82
83
84
85
86
87
88
89
90
91
92
93
94
95
96
97
98
99
100
101
102
103
104
105
106
107
108
109
110
111
112
113
114
115
116
117
118
119
120
121
122
123
124
125
126
127
128
129
130
131
132
133
134
135
136
137
138
139
140
141
142
143
144
145
146
147
148
149
150
151
152
| <template>
<div class="app-container">
<el-form :inline="true" class="demo-form-inline">
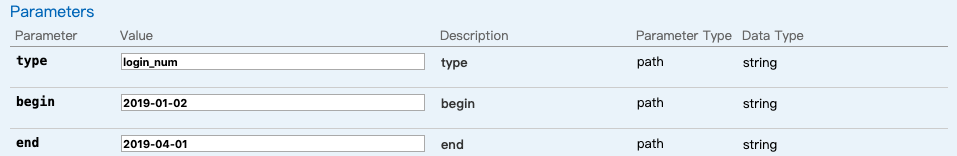
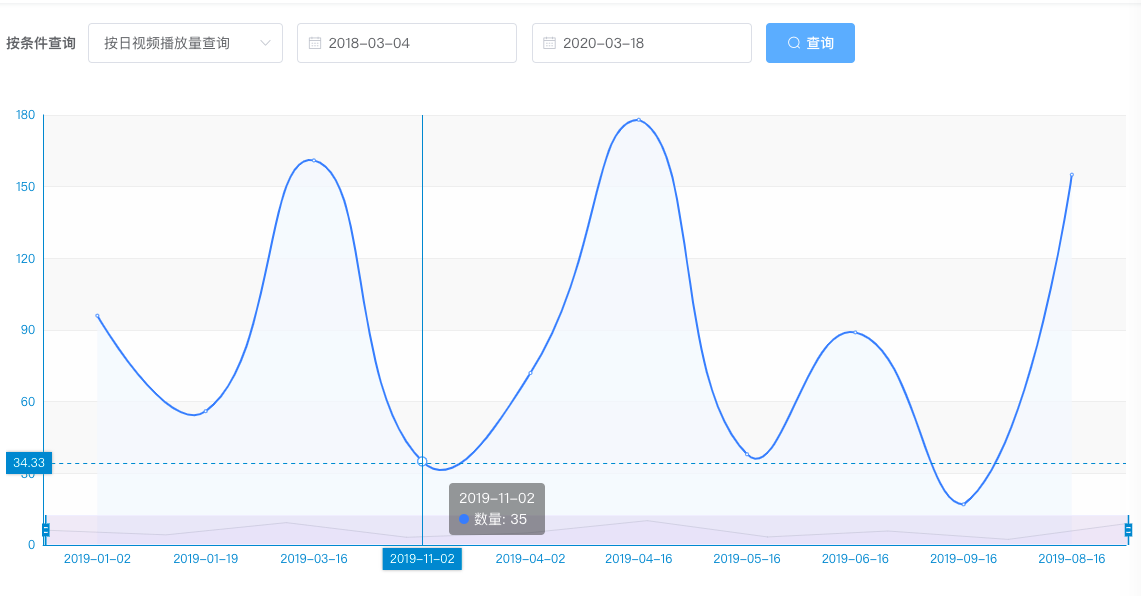
<el-form-item label="按条件查询">
<el-select v-model="searchObj.type" clearable placeholder="请选择查询类型">
<el-option value="register_num" label="按日注册人数查询"/>
<el-option value="login_num" label="按日登录人数查询"/>
<el-option value="video_view_num" label="按日视频播放量查询"/>
<el-option value="course_num" label="按日新增课程数查询"/>
</el-select>
</el-form-item>
<el-form-item>
<el-date-picker
placeholder="请选择开始时间"
type="date"
value-format="yyyy-MM-dd"
v-model="searchObj.begin"/>
</el-form-item>
<el-form-item>
<el-date-picker
placeholder="请选择结束时间"
type="date"
value-format="yyyy-MM-dd"
v-model="searchObj.end"/>
</el-form-item>
<el-form-item>
<el-button type="primary" icon="el-icon-search" @click="showChart">查询</el-button>
</el-form-item>
</el-form>
<div class="chart-container">
    <div id="chart" class="chart" style="height:500px;width:100%;margin-right:50px"/>
</div>
</div>
</template>
<script>
import echarts from 'echarts'
require('echarts/theme/macarons')
import statistic from '@/api/edu/statistic'
export default {
data(){
return{
searchObj:{},
xaxis: [],
number: [],
chart: null
}
}
,created(){
this.resetData()
this.searchObj={}
},
methods:{
showChart(){
this.chart=null
this.initChartData()
},
//读取返回数据
initChartData(){
statistic.getCountData(
this.searchObj.type,
this.searchObj.begin,
this.searchObj.end)
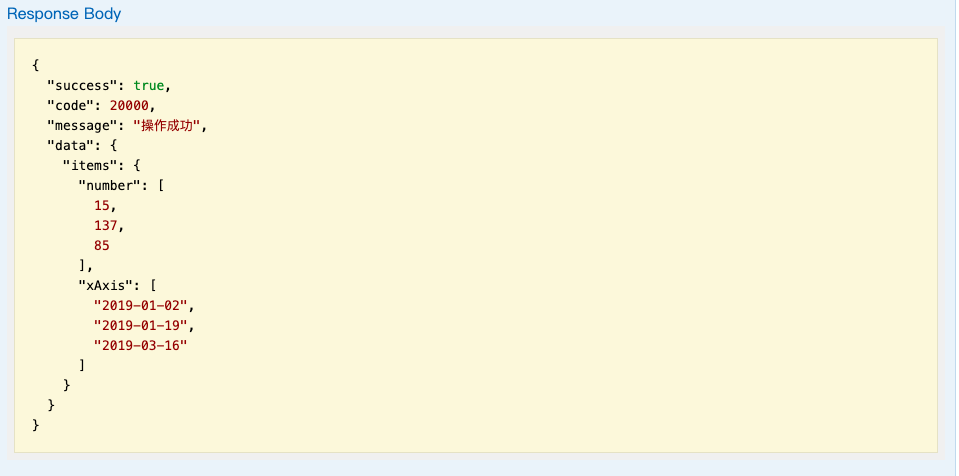
.then(response=>{
//console.log(response)
this.xaxis = response.data.items.xAxis
this.number = response.data.items.number
console.log(this.xaxis)
console.log(this.number)
this.setOptionData()
})
},
setOptionData(){
this.chart = echarts.init(document.getElementById('chart'), 'macarons')
this.chart.setOption({
xAxis:{
type: 'category',
data: this.xaxis,
//留边
// boundaryGap: ['10%','10%'],
//刻度
axisTick: {
show: false
}
},
//显示直角坐标系网格
grid: {
left: 10, //离容器左侧的距离
right: 10, //离容器右侧的距离
bottom: 20, //离容器下侧的距离
top: 30, //grid 组件离容器上侧的距离
containLabel: true //区域是否包含坐标轴的刻度标签
},
//提示框组件
tooltip: {
trigger: 'axis', //坐标轴触发
axisPointer: {
type: 'cross' // 十字准星指示器
},
// 设置上下的内边距为 5,左右的内边距为 10
padding: [5, 10]
},
yAxis: {
type: 'value',// 数值轴
axisTick: {
show: false
}
},
legend: {
data: ['']
},
series: [{
name: '数量',
smooth: true, //是否平滑曲线显示
type: 'line', //折线图
itemStyle: {
normal: {
color: '#3888fa',
lineStyle: {
color: '#3888fa',
width: 2
},
areaStyle: {
color: '#f3f8ff'
}
}
},
data: this.number, // 与 xAxis.data 一一对应
animationDuration: 2000, //初始动画的时长
animationEasing: 'quadraticOut' //初始动画的缓动效果
}],
//用于区域缩放
dataZoom:[{
show:true,
height:30,
//指定 dataZoom 控制x轴
xAxisIndex:[0],
bottom: 40,
start: 0,
borderColor: '#90979c'
}]
})
}
}
}
</script>
|