数据可视化可以把数据从冰冷的数字转换成图形
ECharts官网地址:https://echarts.apache.org/
1. 基础认知
1.1. 常见的数据可视化库
D3.js:目前WEB端评价最高的JavaScript可视化工具库(入手难)ECharts.js:百度出品的一个开源JavaScript数据可视化库Highcharts.js:国外的前端数据可视化库,非商用免费,被许多国外大公司所使用AntV:蚂蚁金服全新一代数据可视化解决方案
1.2. ECharts
ECharts,一个使用 JavaScript 实现的开源可视化库,可以流畅的运行在 PC 和移动设备上,兼容当前绝大部分浏览器(IE8/9/10/11,Chrome,Firefox,Safari等)。
ECharts官网地址:https://echarts.apache.org/
官网教程快速上手ECharts:https://echarts.apache.org/handbook/zh/get-started/
1.3. ECharts使用五步曲
下载并引入echarts.js文件;(图表依赖这个js库)
准备一个具备大小的DOM容器;(生成的图表会放入这个容器内)
1
2
3
4
5
6
7
8<style>
.box{
width: 300px;
height: 300px;
background-color: pink;
}
</style>
<div class="box"></div>初始化echarts实例对象;(实例化echarts对象)
1
var myChart = echarts.init(document.querySelector('.box'));
指定配置项和数据(option);(根据具体需求修改配置选项)
1
2
3
4
5
6
7
8
9
10
11
12
13
14
15
16
17
18
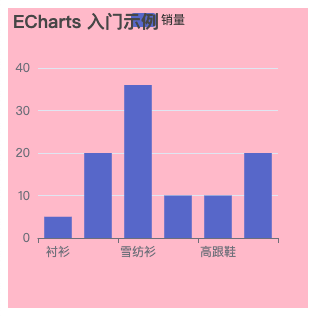
19var option = {
title: {
text: 'ECharts 入门示例'
},
tooltip: {},
legend: {
data: ['销量']
},
xAxis: {
data: ['衬衫', '羊毛衫', '雪纺衫', '裤子', '高跟鞋', '袜子']
},
yAxis: {},
series: [
{
name: '销量',
type: 'bar',
data: [5, 20, 36, 10, 10, 20]
}]
};将配置项设置给echarts实例对象;(让echarts对象根据修改好的配置生效)
1
myChart.setOption(option);
运行
1.4. Echarts-基础配置 option
https://echarts.apache.org/zh/option.html#title
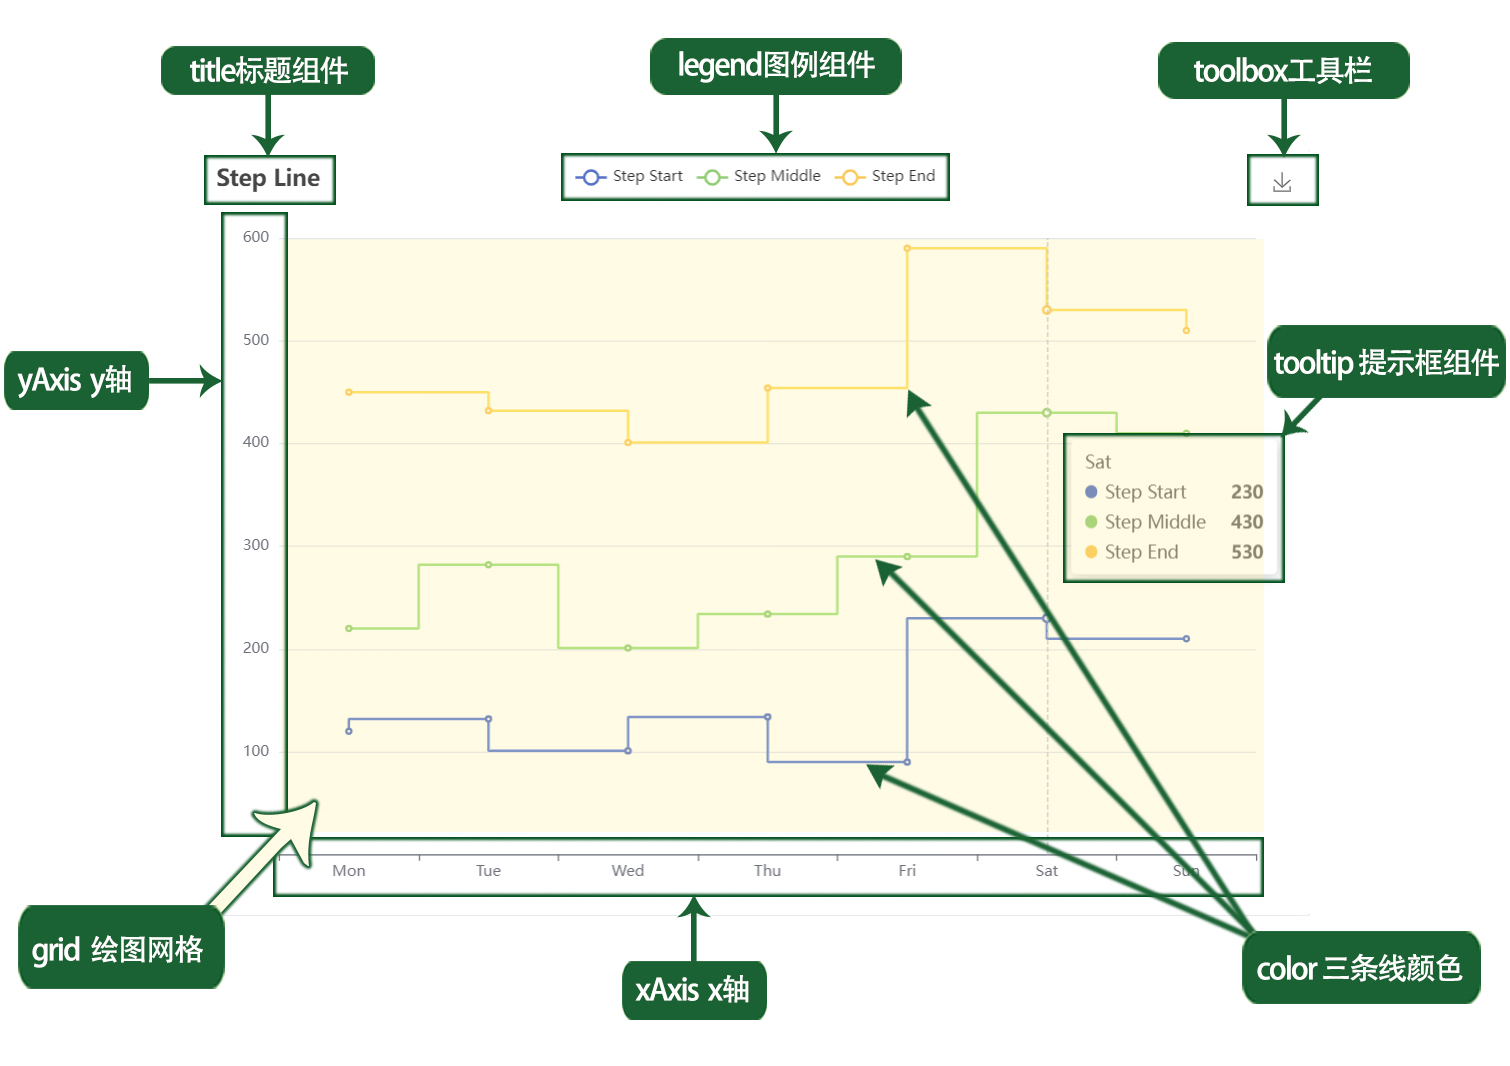
1.4.1. title 标题
标题组件,包含主标题和副标题
1 | title:{ |
1.4.2. legend 图例组件
图例组件展现了不同系列的标记(symbol),颜色和名字。可以通过点击图例控制哪些系列不显示
1 | legend: { |
legend.data
1 | data: [{ |
1.4.3. tooltip 提示框组件
1 | tooltip:{ |
1.4.3.1. trigger触发类型
可选:
'item'数据项图形触发,主要在散点图,饼图等无类目轴的图表中使用
'axis'坐标轴触发,主要在柱状图,折线图等会使用类目轴的图表中使用
'none'什么都不触发
1.4.3.2. formatter
a - series系列图标名称
b - series数据名称data里面的name
c - series数据名称data里面的value
d - 当前数据/总数据的比例
1.4.4. grid 内绘图网格
1 | grid:{ |
grid组件离容器四侧的距离值可以是像 20 这样的具体像素值,可以是像 '20%' 这样相对于容器高宽的百分比,也可以是 'left', 'center', 'right'。
如果 值为'left', 'center', 'right',组件会根据相应的位置自动对齐。
containLabel :grid 区域是否包含坐标轴的刻度标签
1.4.5. color 调色盘颜色列表
1 | color: ['#5470c6', '#91cc75', '#fac858', '#ee6666', '#73c0de', '#3ba272', '#fc8452', '#9a60b4', '#ea7ccc'] |
1.4.6. xAxis x 轴
1 | xAxis: { |
1.4.6.1. type 坐标轴类型
可选:
'value'数值轴,适用于连续数据。'category'类目轴,适用于离散的类目数据。'time'时间轴,适用于连续的时序数据,与数值轴相比时间轴带有时间的格式化,在刻度计算上也有所不同,例如会根据跨度的范围来决定使用月,星期,日还是小时范围的刻度。'log'对数轴。适用于对数数据。
1.4.6.2. boundaryGap坐标轴两边留白策略
类目轴中 boundaryGap 可以配置为 true 和 false。默认为 true,这时候刻度只是作为分隔线,标签和数据点都会在两个刻度之间的带(band)中间。
非类目轴,包括时间,数值,对数轴,boundaryGap是一个两个值的数组,分别表示数据最小值和最大值的延伸范围,可以直接设置数值或者相对的百分比,在设置 min 和 max后无效。 示例:
1 | boundaryGap: ['20%', '20%'] |
1.4.7. yAxis y 轴
1 | yAxis:{ |
type 坐标轴类型
可选:
'value'数值轴,适用于连续数据。'category'类目轴,适用于离散的类目数据。'time'时间轴,适用于连续的时序数据,与数值轴相比时间轴带有时间的格式化,在刻度计算上也有所不同,例如会根据跨度的范围来决定使用月,星期,日还是小时范围的刻度。'log'对数轴。适用于对数数据。
1.4.8. series 系列列表
每个系列通过 type 决定自己的图表类型
1.4.8.1. type
类型图片
1.4.8.2. name
系列名称
1.4.8.3. stack
数据堆叠。如果设置相同值,数据堆叠。
如果指定不同值或者去掉这个属性,则不会发生数据堆叠
1.4.9. 柱形图线条总结
2. 项目
flexible.js+rem单位+flex布局

2.1. 整体代码
https://www.aliyundrive.com/s/D3b8wKy2rqe
2.2. 适配方案
将屏幕分为24份 flexible.js
1 | (function flexible (window, document) { |
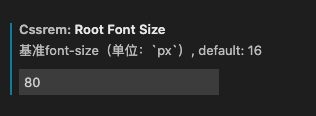
修改vscode的基准值
插件 -> 配置按钮 -> 配置扩展设置 -> Root Font Size
屏幕宽度约束为1024px~1920px
1 | @media screen and (max-width: 1024px) { |
2.3. 基础布局
2.3.1. html
1 |
|
2.3.2. common.css
1 | *{ |
2.3.3. index.css
效果图 1920x1078
viewport主体容器:
- 限制最小宽度1024px,最大宽度1920px,最小高度780px
- 居中显示
- logo.png作为背景图,在容器内显示
- 内间距 88px 20px 0
column 列容器
- 分三列,占比 3:4:3
- 中间容器间距 32px 20px 0
1 | /* 父容器 */ |
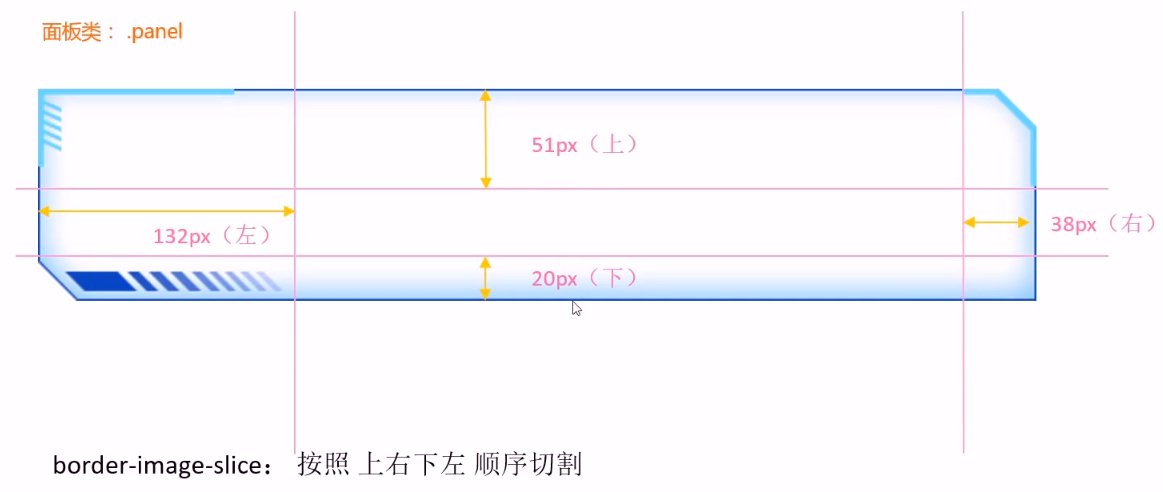
2.4. 边框图片
2.4.1. 切片原理
把四个角切出去,中间部分铺排,拉伸或环绕
2.4.2. 属性
| 属性 | 描述 |
|---|---|
| border-image-source | 用在边框的图片路径 |
| border-image-slice | 图片边框内偏移,裁剪尺寸,不加单位,上右下左顺序 |
| border-image-width | 图片边框宽度,加单位,不会挤压内容 |
| border-image-repeat | 图像边框是否应平铺(repeat),铺满(round),拉伸(stretch),默认拉伸 |
2.4.3. 公共面板样式
1 | .panel{ |
2.4.4. 边框存在导致内容无法顶格显示
添加一个固定定位的盒子,扩大内容
内部容器 内边距 上下24px 左右36px
1 | /* |
2.5. 概览 overview
1 | <!-- 概览区域overview布局 --> |
css
1 | /* 概览区域布局 */ |
2.6. 监控区域 monitor
结构解释:
- .tabs 标签选项,加上active激活选项,默认第一个选项激活
- .content 切换内容 加上display显示内容,默认第一个内容激活
样式描述:
.inner
内间距 24px 0
.tabs
内间距 0 36px
a
颜色 #1950c4
内间距 0 27px
字体 18px
第一个a
去除左侧内间距,右侧2px宽度边框 #00f2f1
激活
颜色 #fff
.content
占满剩余高度 flex:1
默认隐藏
.head
行高1.05
背景 rgba(255,255,255,.1)
内间距 12px 36px
颜色 #68d8fe
字体大小 16px
row
行高 1.05
内间距 12px 36px
颜色 #68d8ff
字体大小 16px
.col-dot
绝对定位
左边 16px
透明度 0 - 隐藏
鼠标经过
背景 rgba(255,255,255,.1)
透明度 1
col
宽度 80px 200px 80px
第二个col 一行不换行 溢出 省略
2.6.1. html
1 | <!-- 监控区域模块制作 --> |
2.6.2. css
1 | /* 监控 */ |
2.6.3. js
1 | $(function(){ |
2.7. 点位分布 point
2.7.1. html
1 | <!--点位--> |
2.7.2. css
1 | /* 点位 */ |
2.7.3. js - 饼图
编辑数据 https://echarts.apache.org/examples/zh/editor.html?c=pie-roseType
1 | //点位-饼图 |
修改
颜色
1
color: ['#006cff', '#60cda0', '#ed8884', '#ff9f7f', '#0096ff', '#9fe6b8', '#32c5e9', '#1d9dff']
图大小
1
radius: ['10%', '70%']
数据
1
2
3
4
5
6
7
8
9
10data: [
{ value: 20, name: '云南' },
{ value: 15, name: '北京' },
{ value: 15, name: '山东' },
{ value: 25, name: '河北' },
{ value: 20, name: '江苏' },
{ value: 35, name: '浙江' },
{ value: 30, name: '四川' },
{ value: 40, name: '湖北' }
]字体
https://echarts.apache.org/zh/option.html#series-pie.label
1
2
3
4
5
6
7
8
9
10series: [
{
//文字调整
label: {
fontSize: 10,
backgroundColor: '#101129',
color: '#fff'
}
}
]引导线
https://echarts.apache.org/zh/option.html#series-pie.labelLine
1
2
3
4
5
6
7
8
9series: [
{
//引导线
labelLine: {
length: 6,
length2: 8
}
}
]等比例缩放
1
2
3
4//图表等比例缩放
$(window).on("resize",function(){
echart.resize();
});
完整js
1 | //点位-饼图 |
2.8. 地图模块
2.8.1. html
1 | <!-- 地图模块 --> |
2.8.2. css
1 | /* 地图 */ |
2.8.3. js - https://www.isqqw.com/
选取相应样式
2.9. 用户模块
2.9.1. html
1 | <!-- 用户模块 --> |
2.9.2. css 同点位分布
1 | /* 点位 同 用户*/ |
2.9.3. js - 柱状图
https://echarts.apache.org/examples/zh/editor.html?c=bar-tick-align
引入数据
1
2
3
4
5
6
7
8
9
10
11
12
13
14
15
16
17
18
19
20
21
22
23
24
25
26
27
28
29
30
31
32
33
34
35
36
37
38
39
40
41// 用户-柱状图
(function(){
var echart = echarts.init($(".users .bar")[0]);
option = {
tooltip: {
trigger: 'axis',
axisPointer: {
type: 'shadow'
}
},
grid: {
left: '3%',
right: '4%',
bottom: '3%',
containLabel: true
},
xAxis: [
{
type: 'category',
data: ['Mon', 'Tue', 'Wed', 'Thu', 'Fri', 'Sat', 'Sun'],
axisTick: {
alignWithLabel: true
}
}
],
yAxis: [
{
type: 'value'
}
],
series: [
{
name: 'Direct',
type: 'bar',
barWidth: '60%',
data: [10, 52, 200, 334, 390, 330, 220]
}
]
};
echart.setOption(option);
})();修改柱颜色
渐变色
1
2
3
4
5
6
7
8
9
10
11
12
13
14
15// 线性渐变,前四个参数分别是 x0, y0, x2, y2, 范围从 0 - 1,相当于在图形包围盒中的百分比,如果 globalCoord 为 true,则该四个值是绝对的像素位置
//顶部为(x0,y0),靠近x轴的是(x2,y2)
color: {
type: 'linear',
x: 0,
y: 0,
x2: 0,
y2: 1,
colorStops: [{
offset: 0, color: '#00fffb' // 0% 处的颜色
}, {
offset: 1, color: '#0061ce' // 100% 处的颜色
}],
global: false
}提示框
1
2
3
4
5
6
7
8
9
10
11tooltip: {
//item-鼠标在柱体上提示
//axis-鼠标在坐标系上就提示
trigger: 'item'
// ,
// // 坐标轴指示器,坐标触发有效
// axisPointer: {
// //默认为直线,line/shadow
// type: 'shadow'
// }
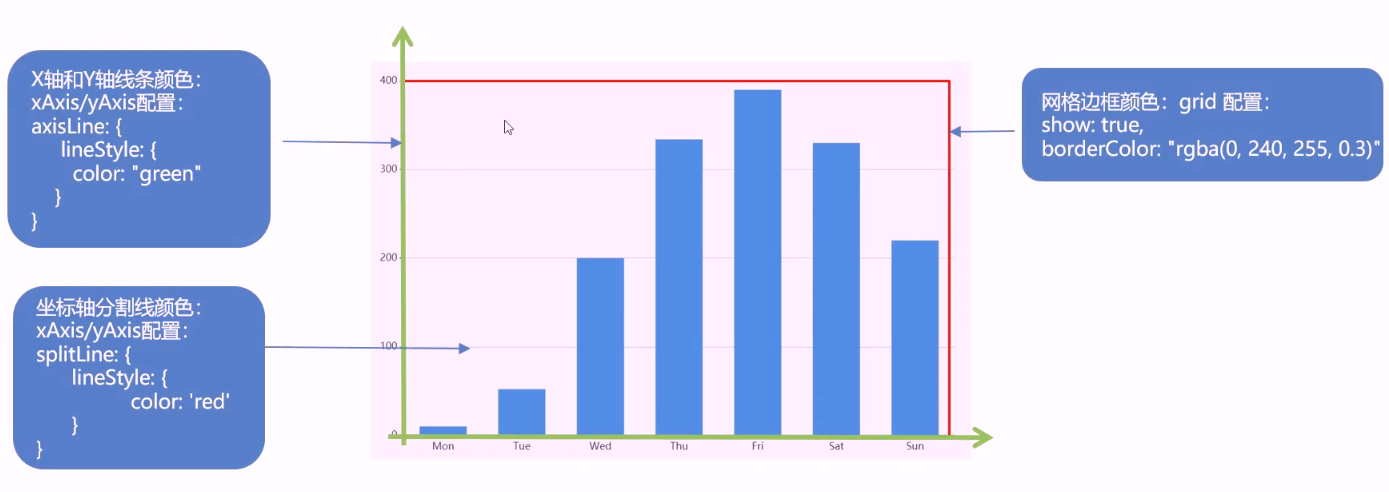
}网格定制 grid
1
2
3
4
5
6
7
8
9
10
11
12grid: {
left: '0%',
right: '3%',
bottom: '3%',
top: '3%',
//是否显示刻度
containLabel: true,
//是否显示直角坐标系网格
show: true,
//直角坐标系网格边框颜色-四条边
borderColor: 'rgba(0,240,255,.3)'
}x轴调整
水平线 axisLine
1 | xAxis: [ |
- y轴调整
splitLine 分割线
1 | yAxis: [ |
- 数据修改
单个柱体可以修改样式
https://echarts.apache.org/zh/option.html#series-bar.data.emphasis
1 | var item = { |
完整js
1 | // 用户-柱状图 |
2.10. 订单模块
2.10.1. html
1 | <!-- 订单 --> |
2.10.2. css
1 | /* 订单 */ |
2.10.3. js
1 | (function(){ |
2.11. 销售模块
2.11.1. html
1 | <!-- 销售额 --> |
2.11.2. css
1 | /* 销售区域 */ |
2.11.3. js - 折线图
https://echarts.apache.org/examples/zh/editor.html?c=line-stack
1 | // 销售 - 折线图 |
2.12. 渠道分布&销售进度
2.12.1. html
1 | <!-- 渠道 季度 --> |
2.12.2. css
1 | /* 渠道区块 */ |
2.12.3. js - 雷达图
https://echarts.apache.org/examples/zh/editor.html?c=radar-aqi
1 | // 渠道分布 |
2.12.4. js- 饼图
https://echarts.apache.org/examples/zh/editor.html?c=pie-doughnut
1 | (function(){ |
2.13. 全国热榜
2.13.1. html
1 | <!-- 排行榜 --> |
2.13.2. css
1 |
|
2.13.3. js
1 | // 排行榜 |